“Unemployment fell from over 14% to 5.4% because of the current government.”
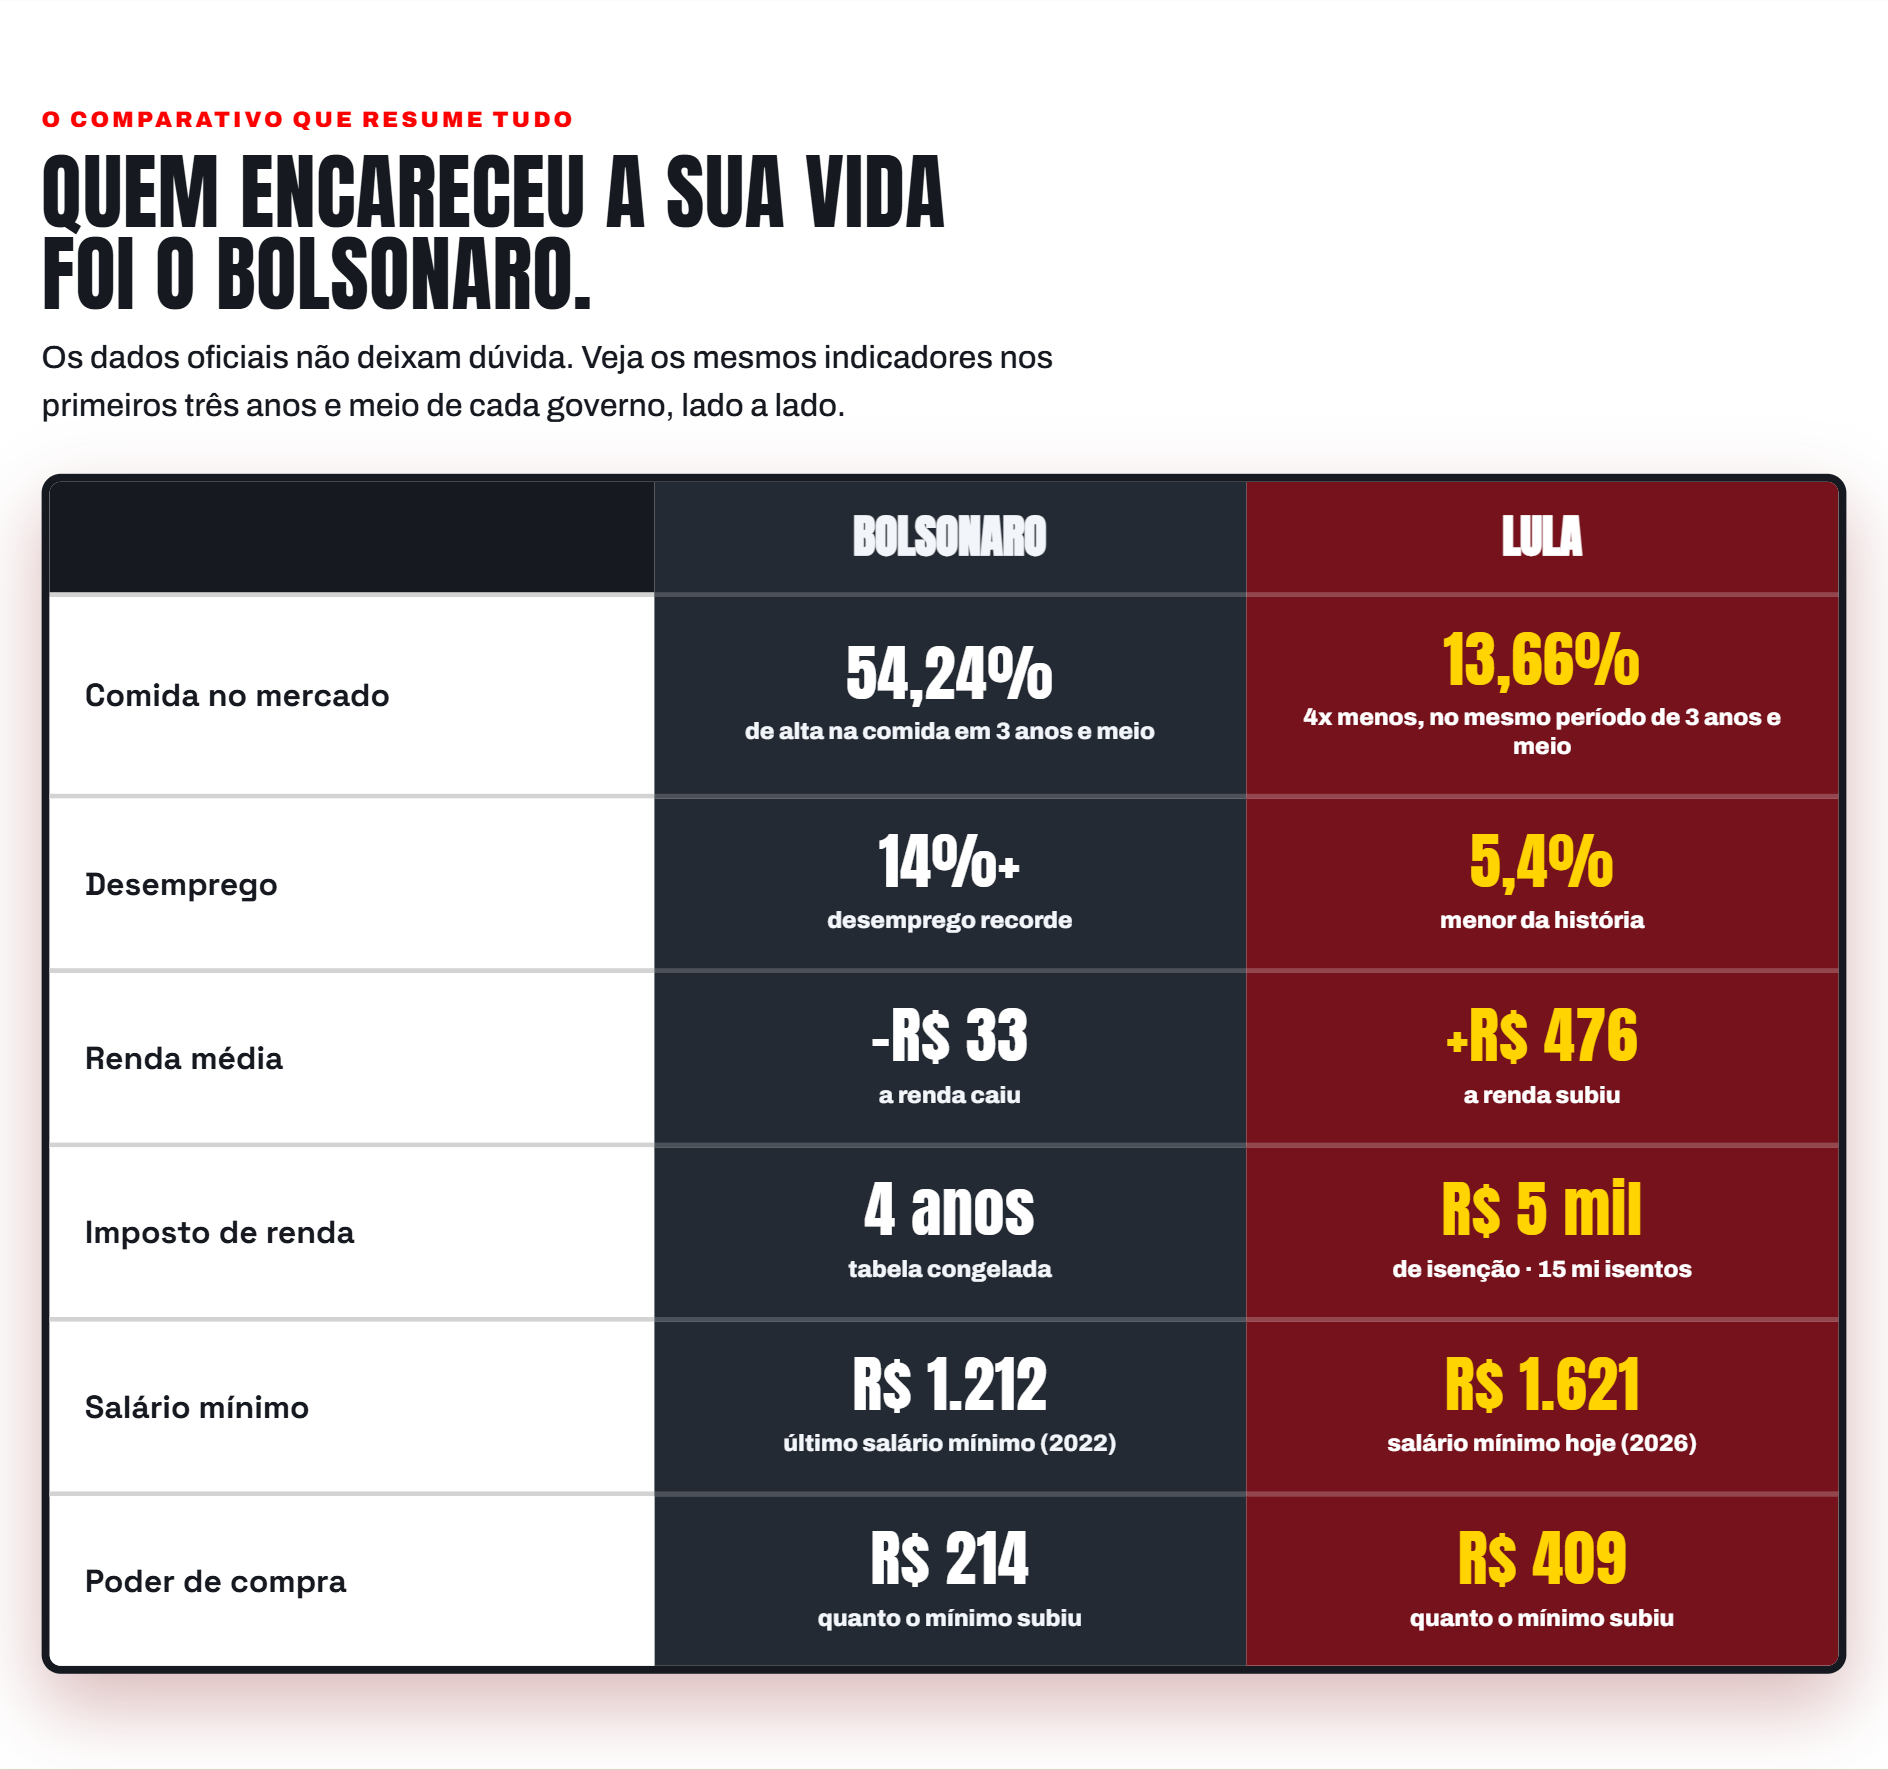
The unemployment row in the original table: “14%+ record unemployment” against “5.4% the lowest in history”.
The 14.9% peak is nobody's starting point.
The site's comparison table puts "14%+" in the previous government's column and 5.4% in the current one. But 14.9% is neither how the previous government started nor how it ended: it was the height of the pandemic, in Q1 2021.
"Record unemployment of 14%+ against 5.4%, the lowest in history."
The site's table puts the worst figure ever recorded on one side and the best on the other, as if they were each government's bottom line.
Compare start with start, and end with end.
The previous government inherited 12.7% (Q1 2019) and handed over 7.9% (Q4 2022): a 4.8-point fall, with the pandemic in the middle.
The current government inherited 7.9% and reached 5.4% (Jun 2026): a 2.5-point fall — a real result and the best on record, but achieved from an inheritance already falling.
The 14.9% belongs to Q1 2021 — a lockdown quarter, not a government's balance sheet.
The 5.4% is true and is the lowest in the series. What is false is the contrast: using the pandemic peak as "the opponent's number" charges a global health shock to a government's account.
Sources: IBGE/PNAD Contínua quarterly — Q1 2019 (12.7%), Q4 2019 (11.0%), Q1 2021 (14.9%, the maximum of the series begun in 2012), Q4 2022 (7.9%), Q4 2023 (7.4%), Q4 2024 (6.2%) and the quarter ending June 2026 (5.4%).
Other fact-checks
This calculation needs to travel.
A bent yardstick travels fast because it is simple. Context travels slowly because it needs explaining. If this check helped you understand the number, it will help someone else too.
The text comes pre-filled with the key figure. Write your own if you prefer — the link is the same.