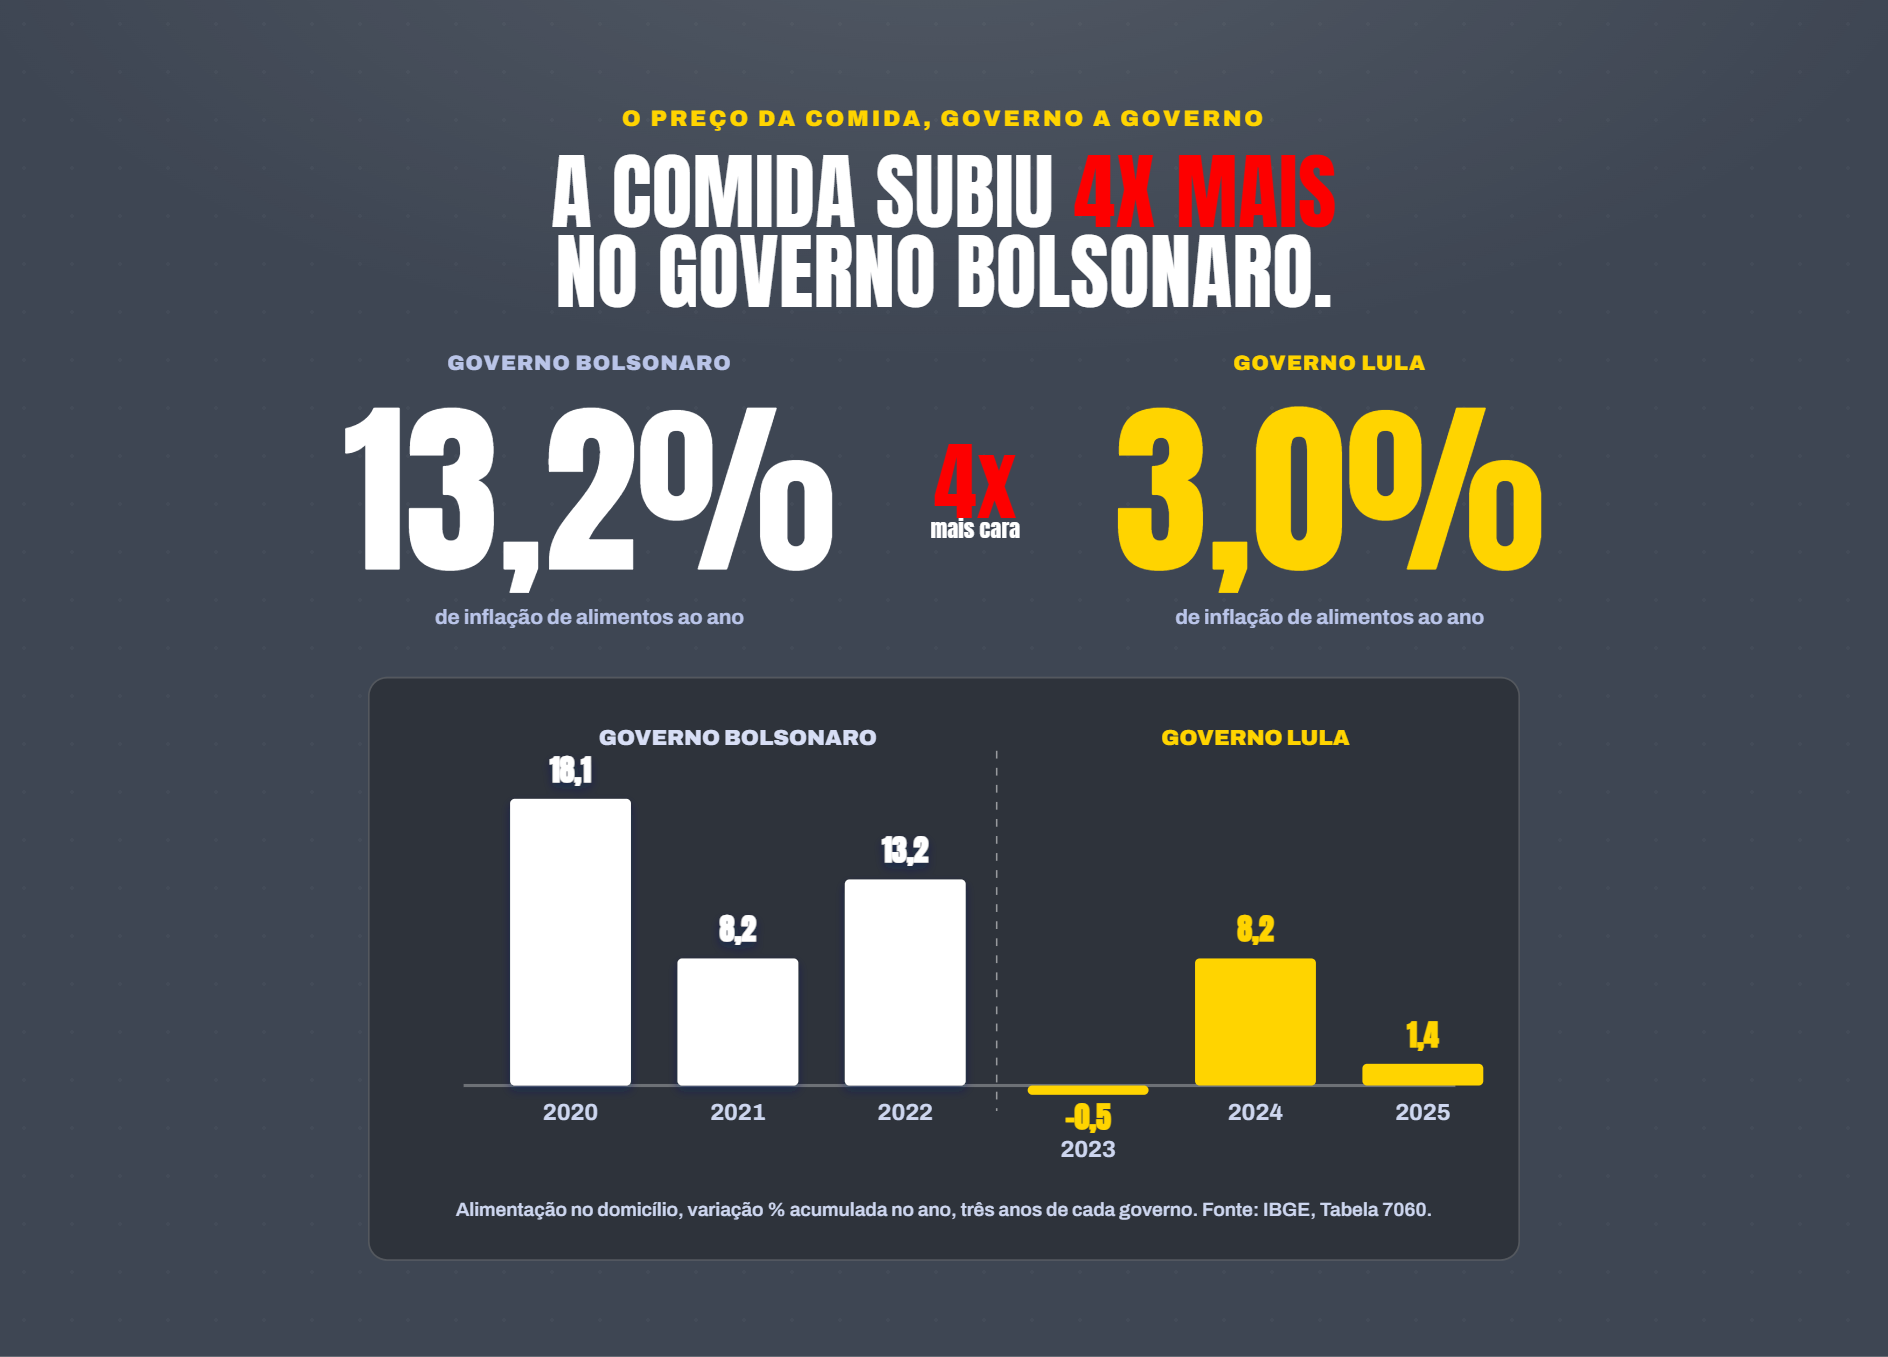
“Food prices rose 4x more under the previous government than the current one.”
The piece compares 13.2% annual food inflation in the earlier window with 3.0% a year in the current one, concluding: “food rose 4x more under Bolsonaro”.
Food got more expensive worldwide — and then eased worldwide.
The site opens with its strongest number: 13.2% annual food inflation in the earlier window against 3.0% a year in the current one. "Four times more expensive." The IPCA figure is correct. The question it does not answer is: four times more expensive because of whom?
"Food rose 4x more under Bolsonaro."
Food consumed at home, IPCA/IBGE Table 7060, three and a half years of each government. 54.24% against 13.66% cumulative.
Three external shocks fit entirely inside the first window.
1. Pandemic and logistics collapse (2020-2021). Shipping costs multiplied, supply chains broke and pent-up demand pushed food prices up worldwide.
2. War in Ukraine (Feb 2022). Russia and Ukraine accounted for about 27% of world wheat exports and more than half of sunflower oil. The FAO global index hit its all-time record in March 2022.
3. Fertilisers. Brazil imports most of what it uses, and Russia and Belarus are central suppliers. Sanctions made the input more expensive — and the input feeds into the price of the following harvest.
Misleading by omission of cause. The gap between the two windows is largely the gap between standing on the climb and standing on the descent of a global commodity cycle. And since the FAO index started rising again in 2026, the very metric used today as proof of competence could become proof of incompetence within months — with nothing having changed in Brasília.
Sources: IBGE/IPCA (Table 7060, food consumed at home); FAO — Food Price Index; FAO/UN releases of March 2022 and September 2026.
Other fact-checks
This calculation needs to travel.
A bent yardstick travels fast because it is simple. Context travels slowly because it needs explaining. If this check helped you understand the number, it will help someone else too.
The text comes pre-filled with the key figure. Write your own if you prefer — the link is the same.